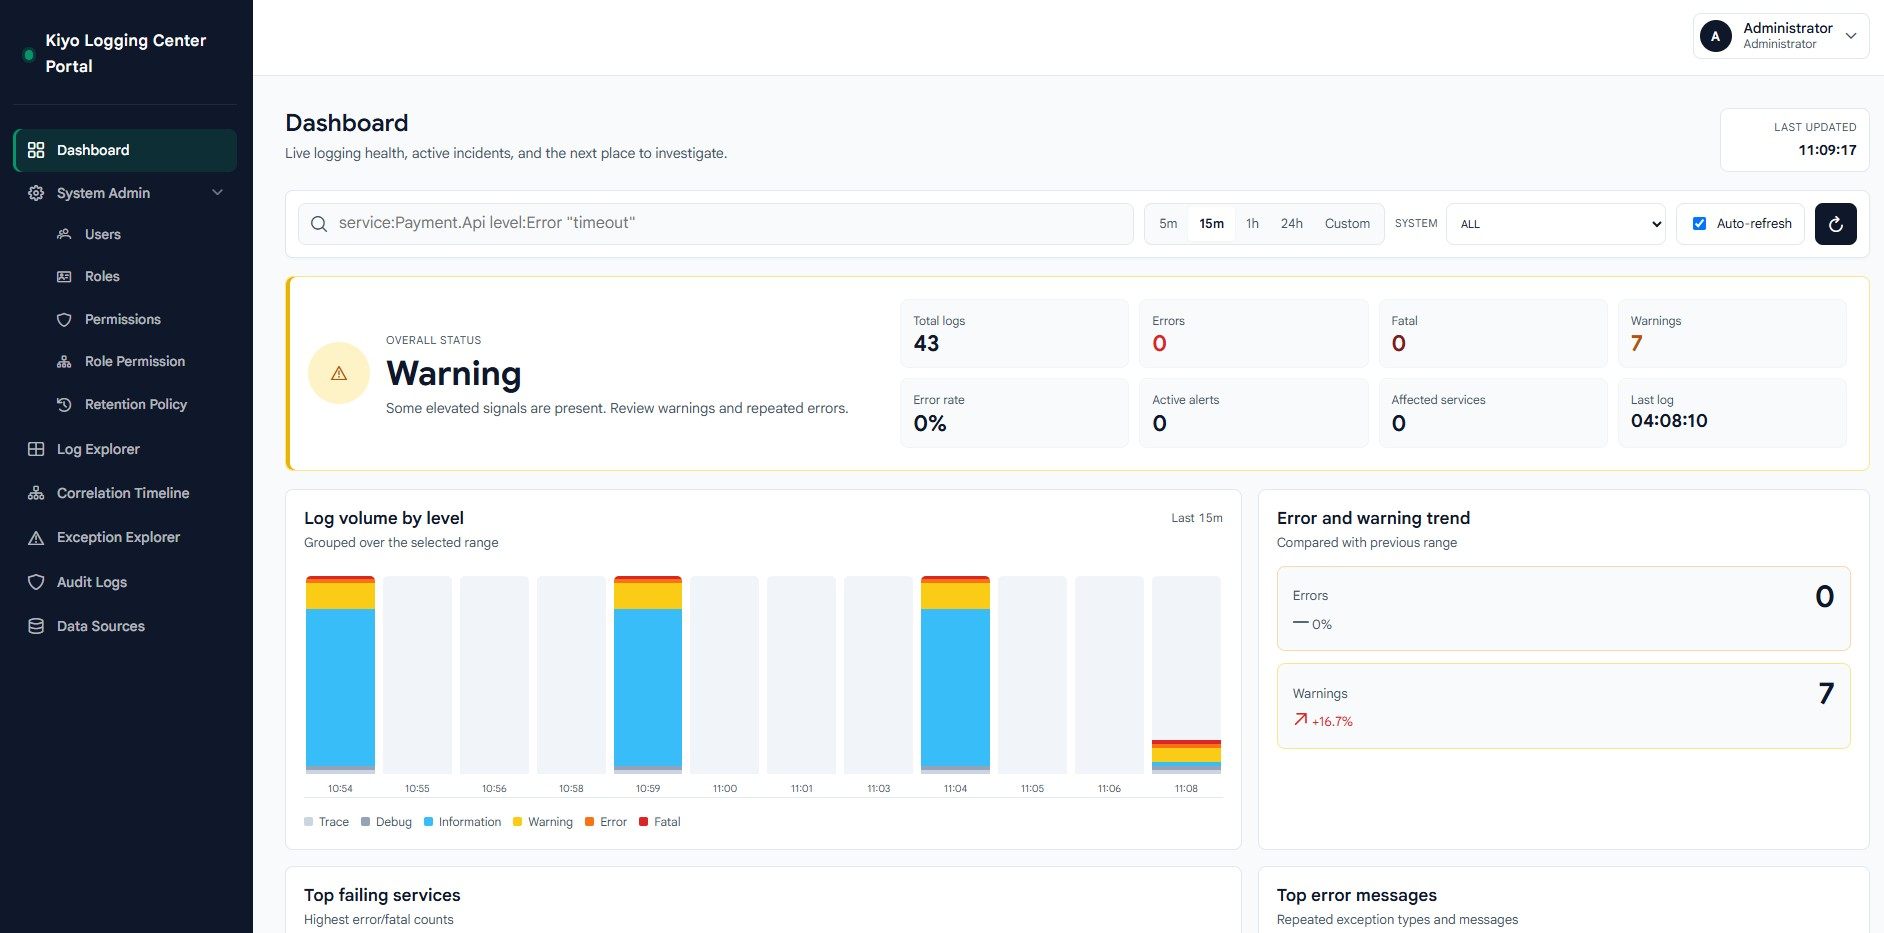
Overview
Kiyo Logging Center is a full-stack platform — a .NET 10 Web API (Clean Architecture + CQRS) backend and an Angular 19 (standalone + signals + PrimeNG) frontend — for bringing logs from many systems together.
Administrators register external log databases as data sources and map their columns to a standard log schema. From there, users can search logs, follow a correlation timeline, explore grouped exceptions, and watch dashboards — all governed by a two-dimensional Resource × PermissionLevel access model.
Why This Project Exists
In most organizations logs are scattered across many databases and applications. When something breaks, engineers open each system separately, with no shared view and no way to follow a request across services.
Kiyo Logging Center exists to remove that friction: one place to search logs, govern who can see what, group recurring exceptions, and define how long logs are kept — so troubleshooting becomes faster and more controlled.
How It Works
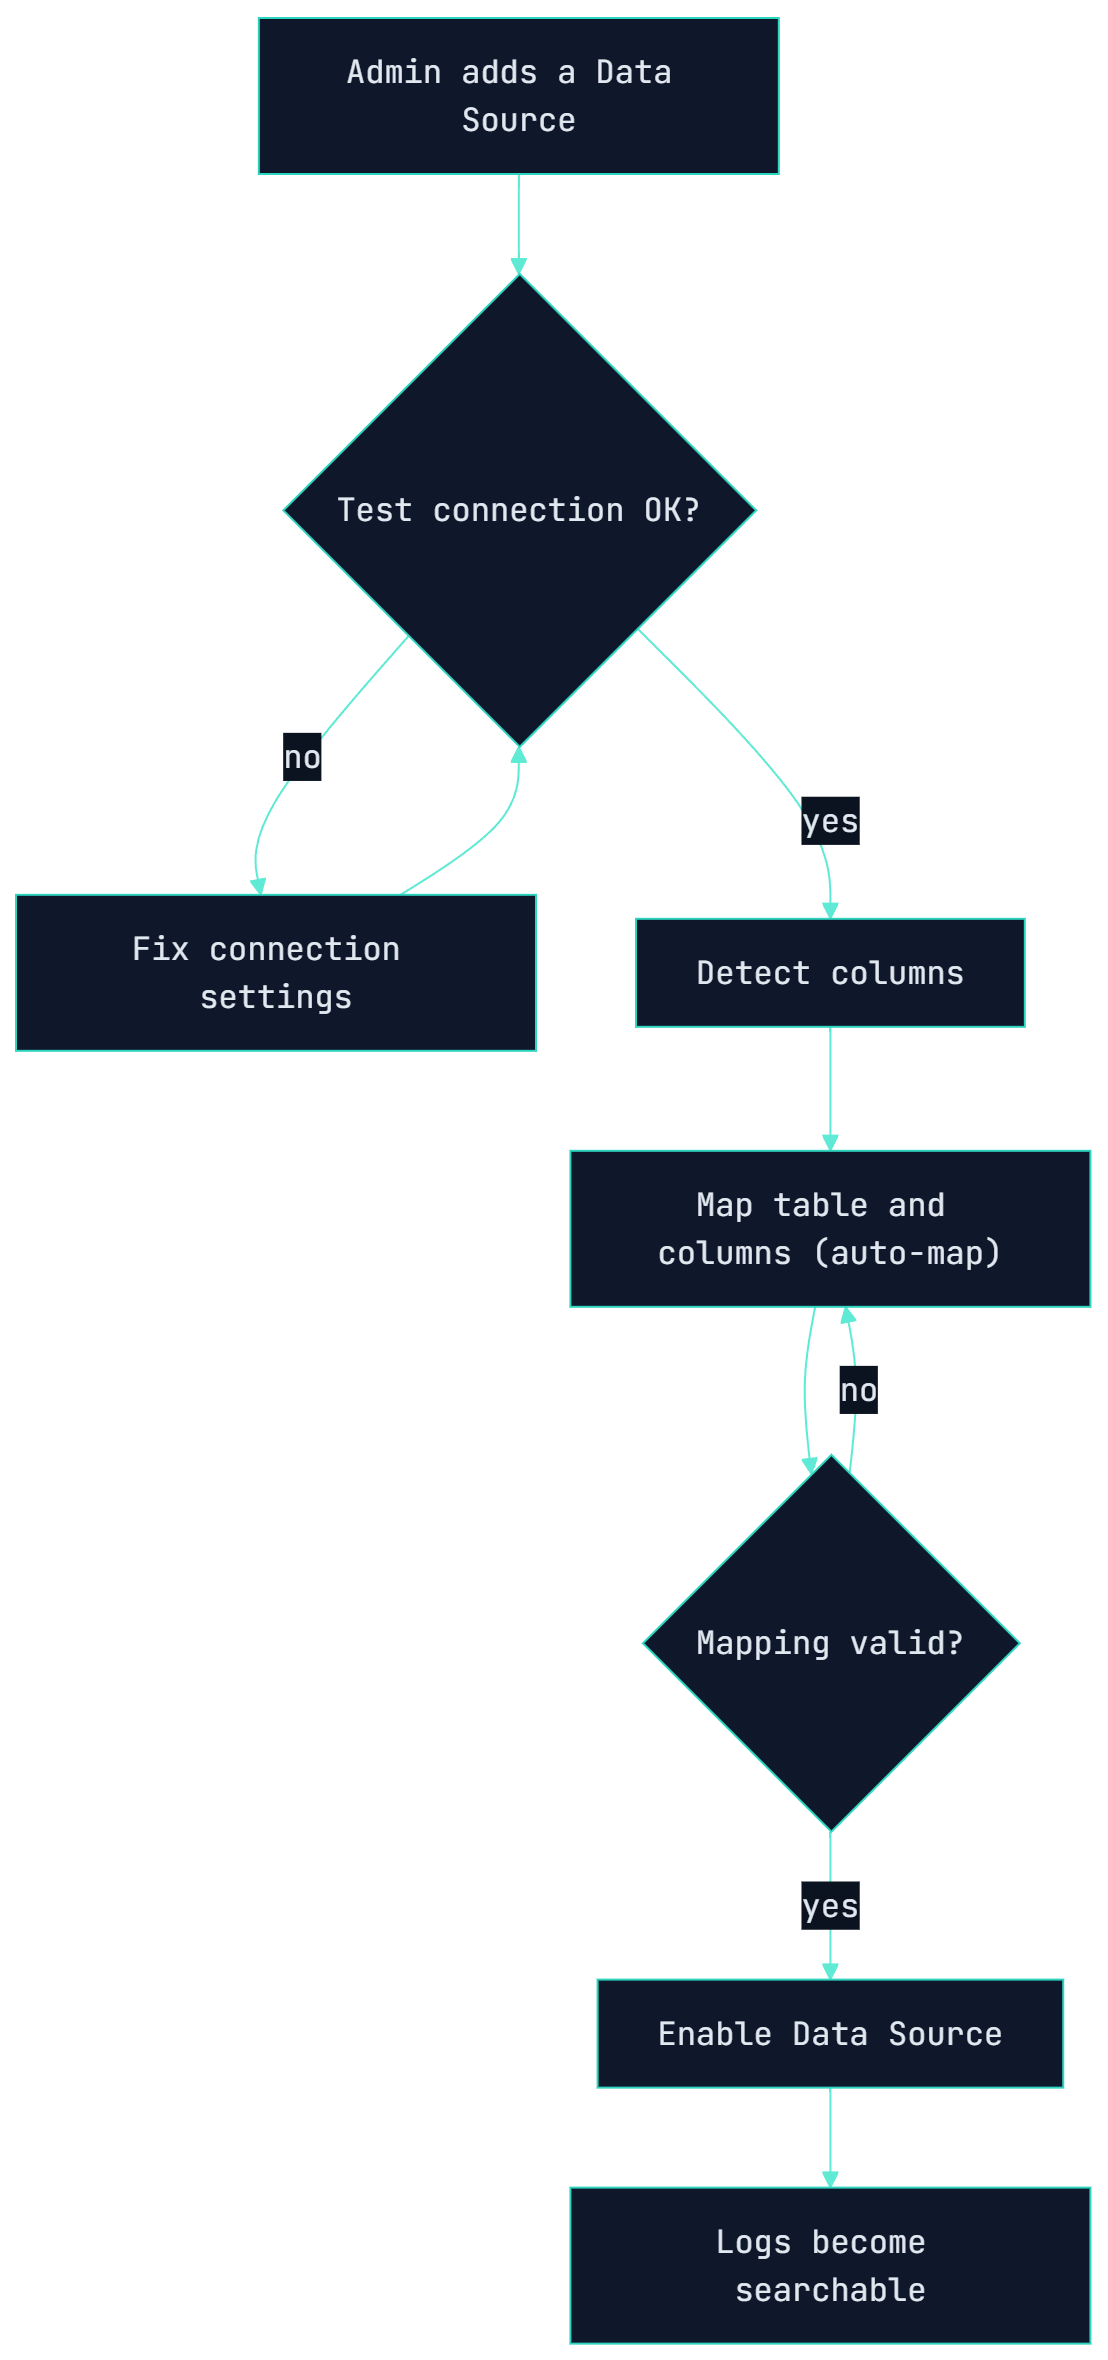
An administrator connects an external log database as a data source, tests the connection, detects its columns, and maps them to the platform’s standard log schema. Once validated and enabled, those logs become searchable.
Users then explore logs across sources, open individual entries, and pivot into a correlation timeline or a grouped exception view. Every protected action is checked against the user’s effective permissions before it runs.
The workflow
- 1A user signs in and receives a JWT used for every request.
- 2An administrator adds an external log database as a data source.
- 3The data source connection is tested, columns detected, and mapping validated.
- 4Once enabled, logs from that source become searchable in Log Explorer.
- 5Users filter by time range, severity, and other conditions, then open log details.
- 6They pivot into the correlation timeline or exception groups to find the root cause.
- 7Dashboards, audit logs, and retention policy keep the system observable and governed.
Who It Is For
The platform is shaped around the people who actually chase down incidents and govern access. Each persona maps to a real permission profile in the Resource × Level model.
Ops / SRE
Traces incidents across systems using Log Explorer and the correlation timeline to cut down time-to-resolution.
Developer
Reviews grouped, recurring exceptions in Exception Explorer to prioritize which bugs to fix first.
System Administrator
Connects data sources, manages users, roles, and permissions, and configures retention policy.
Auditor / Security
Reviews audit logs and ensures access to sensitive logs is controlled and traceable.
Key Features
- Log Explorer — search and filter logs across all connected sources
- Correlation Timeline — follow related events across services
- Exception Explorer — group recurring exceptions
- Dashboard — HTTP metrics and slow-request overview
- Data Sources — connect and map external log databases
- Retention Policy — define how long logs are kept
- Audit Logs — record significant actions in the system
- RBAC — Users, Roles, and Permissions with Resource × Level control
- Localization — database-backed EN/TH translations, an in-app language switcher, and an admin Translations editor
- User Guide — in-app help, including a Serilog setup guide for shipping logs into the platform
- System Settings — system-wide configuration
Real Working Features
Beyond the visual metaphor, the office runs real integrations. Here is how the main flows actually work.
Data Source Onboarding
An administrator registers an external log database, tests the connection, and lets the system detect its columns. Those columns are then mapped — manually or via auto-map — to the platform’s standard log schema and validated before the source is enabled.
The data-source menu is restricted to the Administrator role. Both SQL Server and PostgreSQL log databases are supported through the DataSourceConnector.
Search Logs Across Sources
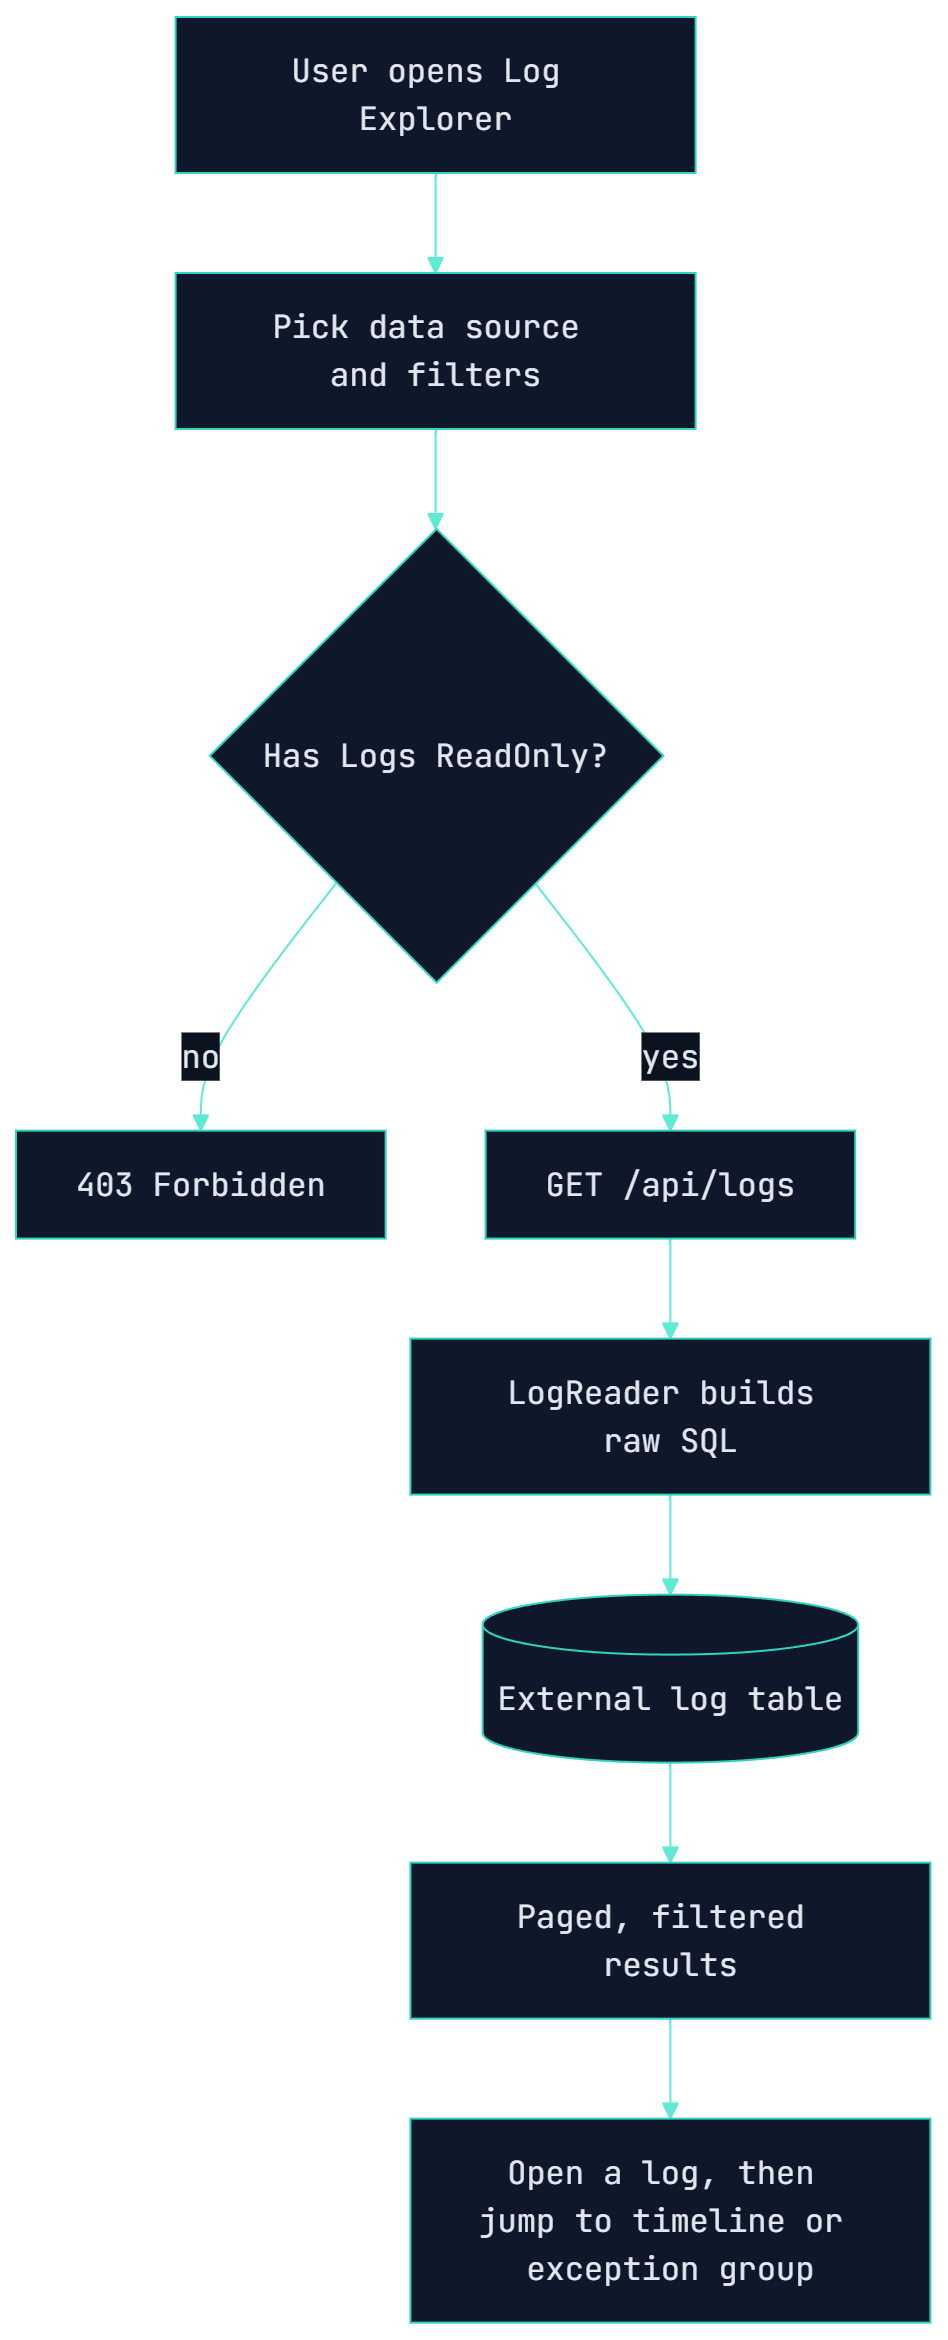
In Log Explorer a user picks a data source and filters, and the request is authorized against the Logs · ReadOnly permission before anything runs. A Dapper-based LogReader builds raw SQL against the mapped external table and returns paged, filtered results.
From a single log entry, users can pivot into the correlation timeline to follow a request across services, or into the grouped exception view.
Resource × Level Authorization
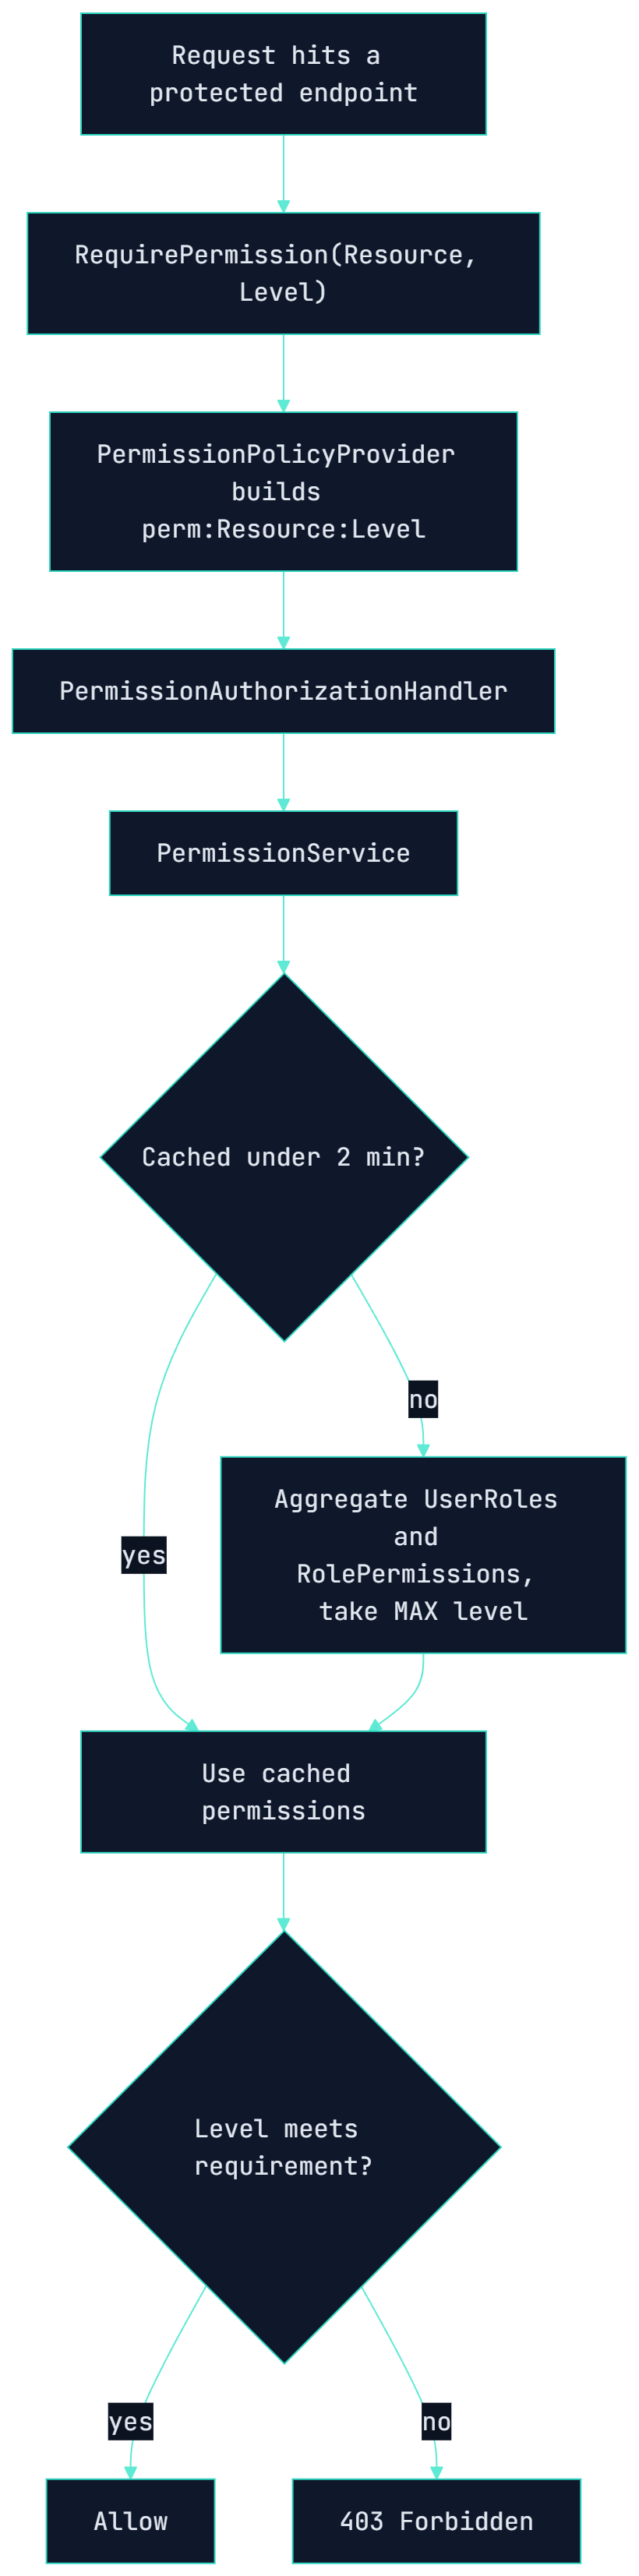
Every protected endpoint is decorated with RequirePermission(Resource, Level). A dynamic policy provider synthesizes the policy on demand, and a handler resolves the user’s effective permissions by aggregating their roles and taking the highest level per resource.
Results are cached per user for two minutes to keep authorization fast — the trade-off being that permission changes do not propagate instantly to live sessions.
Architecture
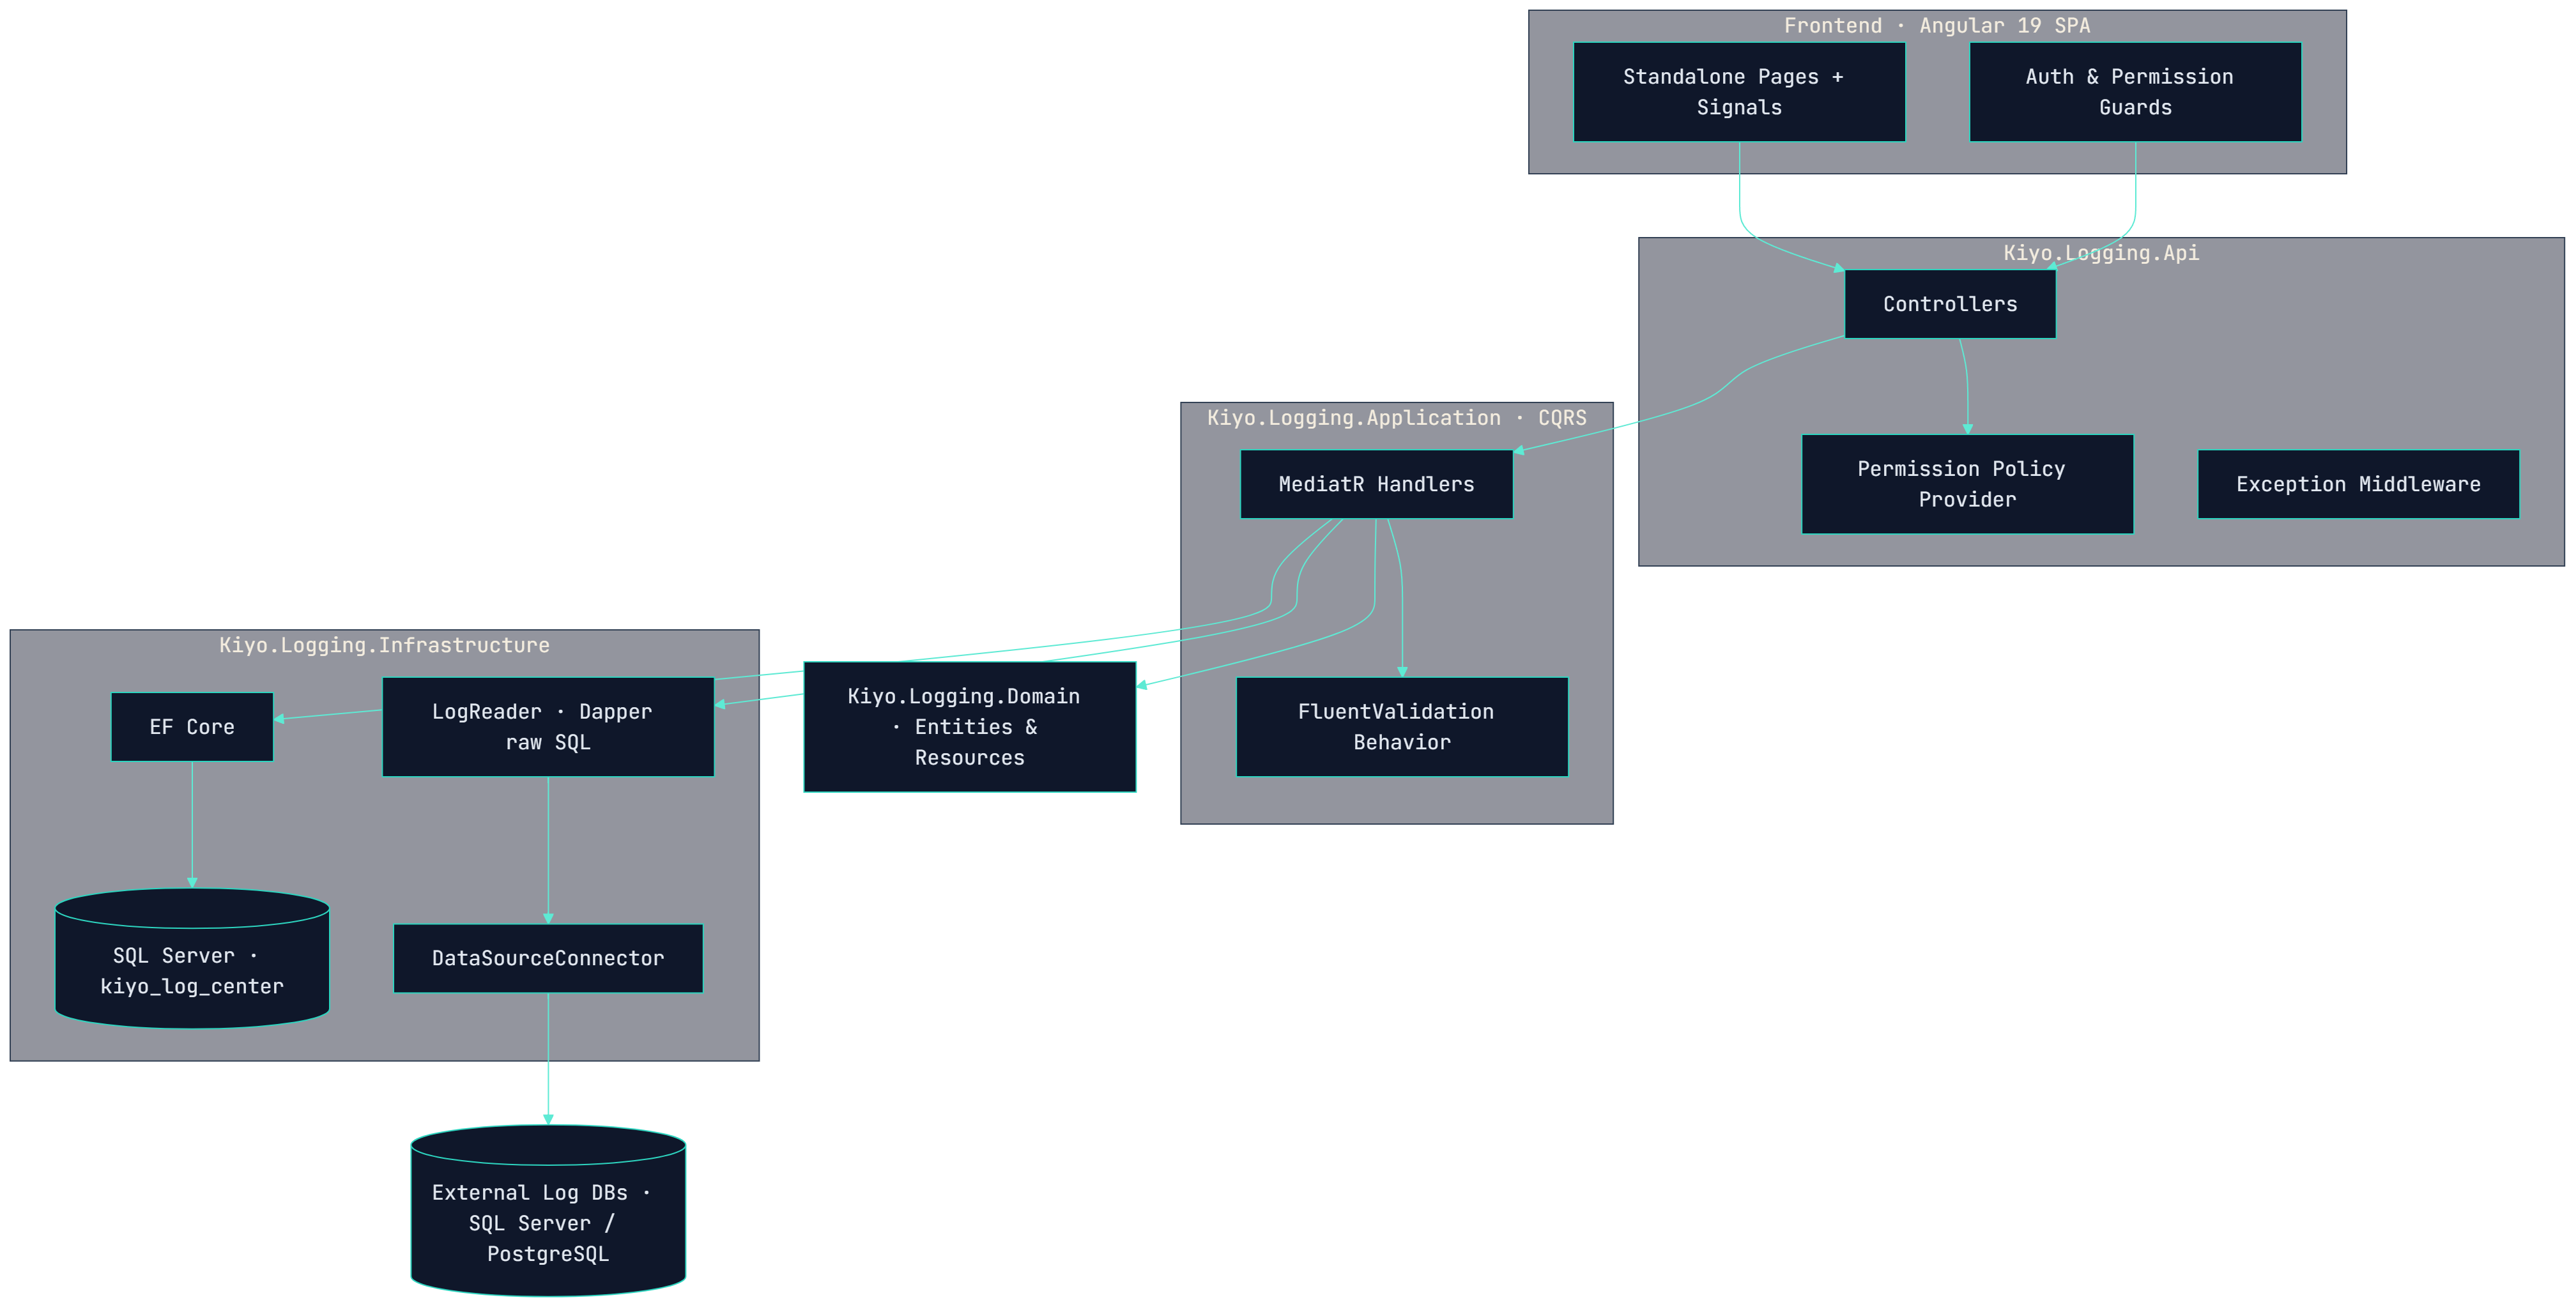
The backend follows Clean Architecture across four projects — Domain, Application, Infrastructure, and Api — with CQRS through MediatR and a FluentValidation pipeline. EF Core handles the platform’s own SQL Server database, while a Dapper-based LogReader runs raw SQL against external log sources.
The frontend is an Angular 19 single-page app using standalone components and signals, with lazy-loaded routes protected by auth and permission guards. Authorization is enforced end to end through a custom RequirePermission attribute and a dynamic policy provider, with per-user permissions cached for two minutes.
Architecture
A Clean Architecture backend with CQRS reads its own SQL Server store via EF Core, while a Dapper LogReader queries external log databases behind an Angular SPA.
Technology Stack
A .NET 10 backend with Clean Architecture, CQRS, EF Core, and Dapper over SQL Server, paired with an Angular 19 + PrimeNG frontend. External log sources support both SQL Server and PostgreSQL.
- .NET 10
- Clean Architecture
- CQRS
- MediatR
- EF Core
- Dapper
- SQL Server
- PostgreSQL
- Angular 19
- PrimeNG
- Signals
- JWT
- Serilog
- i18n (EN/TH)
Notes & Constraints
- The project name evolved from the earlier "Kiyo Web" template into a dedicated logging platform (KiyoLogging.sln → Kiyo.Logging.*).
- Raw SQL via Dapper is intentionally kept for the log readers rather than being converted to LINQ.
- Authorization is centralized: permission checks aggregate UserRoles and RolePermissions and take the max level per resource.
- Automated tests are not in place yet — the tests folder is currently empty.
- Deployment documentation and some data-source mapping details are still to be verified.
What's Next
- Add real screenshots and a live demo
- Add refresh-token rotation and login rate limiting
- Add automated unit and integration tests
- Invalidate the permission cache immediately on role or user changes
- Document a deployment path
- Verify and document data-source column mapping per source type